U.S. Solar Market: by the Numbers
Each quarter the Solar Energy Industries Association (SEIA) releases a report detailing the status of the U.S. solar market and provides insights into what to expect in the future. This quarter, we thought we’d share some of our favorite statistics from the most recent report:
-
Photovoltaic (PV) installations reached 930 MW in Q3 2013, up 20% over Q2 2013. This quarter was the second-largest solar installation quarter in U.S. history.
-
The utility solar sector represented more than half of new PV capacity installed.
-
The residential market posted its largest quarter in history with 186 MW installed, and a 52% growth rate.
-
2013 may be the first year in more than a decade in which the U.S. installs more solar capacity than Germany.
-
Blended average PV system prices fell 4.2% in Q3 2013 compared to the previous quarter, reaching a new low of $3.00/W.
-
Total 2013 projected PV is 4.3 GW of installations, up 27% over 2012.
-
Installations have already surpassed the 10 GW mark.
-
By year’s end, more than 400,000 individual solar projects will be operating across the country.
-
Maryland fell from 10th to 15th in PV state rankings, falling behind Vermont, Delaware, and Missouri, amongst others.
Clearly, solar power is growing rapidly. Unfortunately, it seems as though solar programs have only evolved heavily in certain states. Others have not fared as well. It will be interesting to see whether that trend continues given the ever-decreasing price of solar.
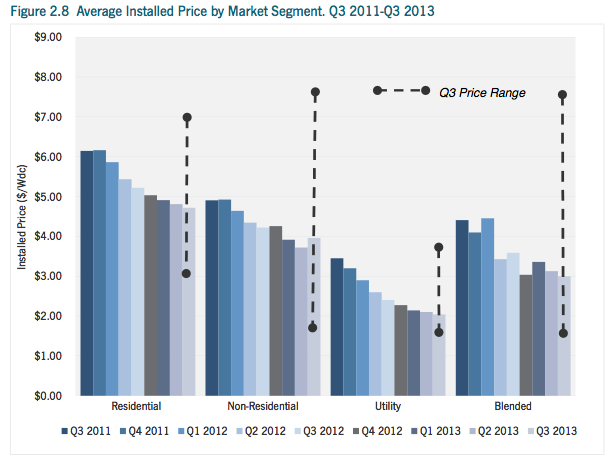
Average Installed Price by Market Segment. Q3 2011-Q3 2013